Wind Measurements
Below are some examples of wind measurements. The illustrations show the wind speed and the image of signal strength.
Below are some examples of wind measurements. All illustrations are measurements in a fixed direction with the new LiTra S with 71 mm telescope aperture. In the left image (upper image for small views) the wind speed in m/s and in the right image the signal strength in dB are represented by the colour. The X-axis is the time scale and the Y-axis is the distance to the instrument.
The wind speed is always the component along the laser beam. Positive speeds are wind directions directed away from the system.
The following pictures were taken with an elevation of 90°, i.e. directed vertically upwards. They show measurements on a November day during a comparative measurement at the Institute for Tropospheric Research in Leipzig.
This measurement was taken at a pulse rate of 10 kHz, averaged over 2 s (i.e. 20,000 shots).
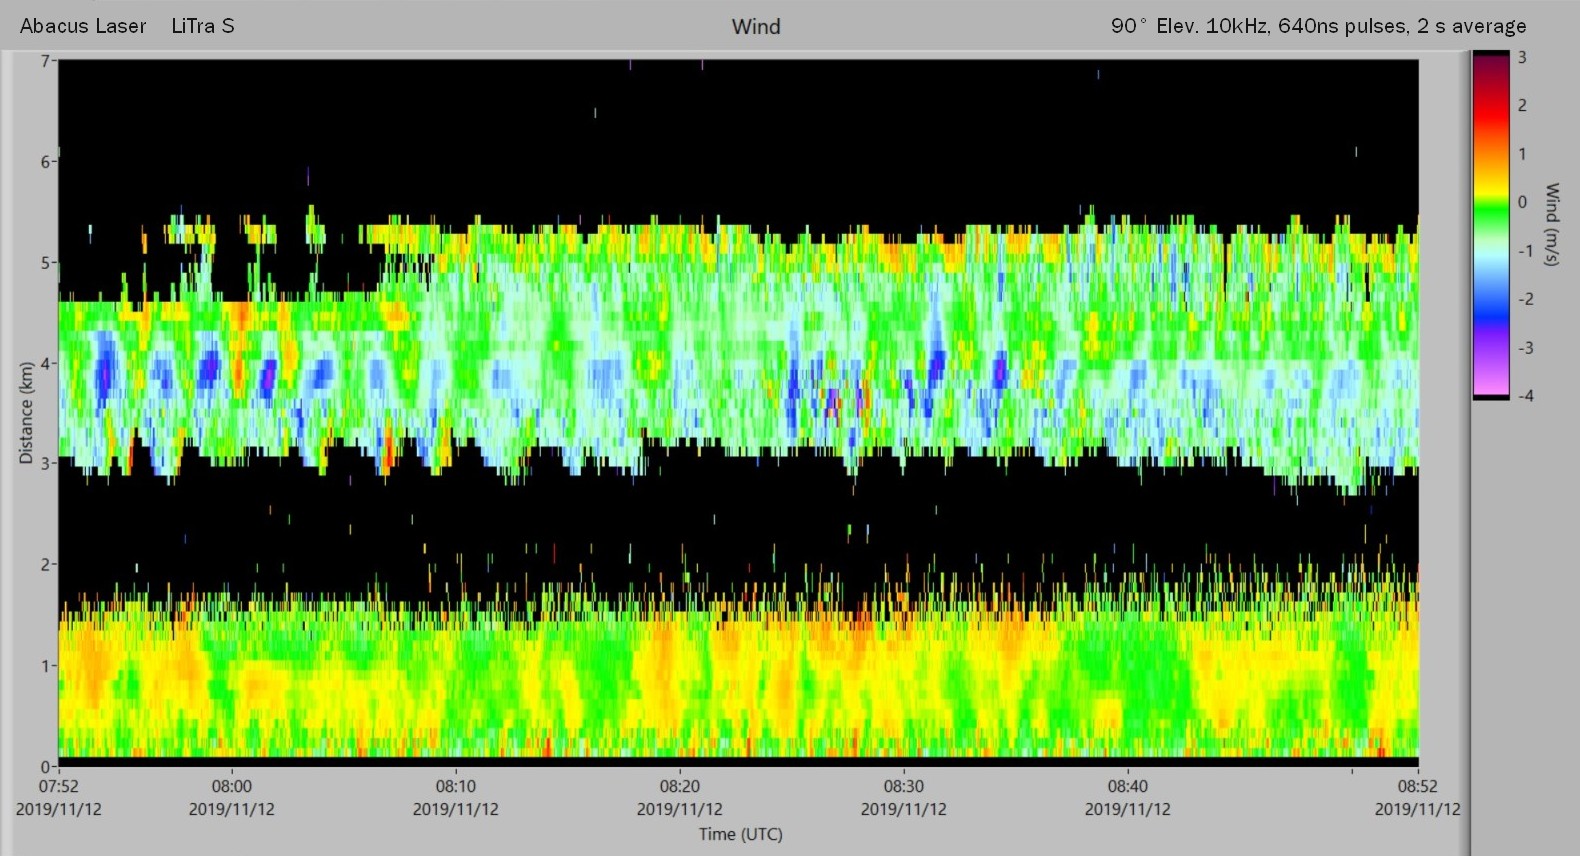
Wind speed for measurement with 90° elevation along a period of 1 hour
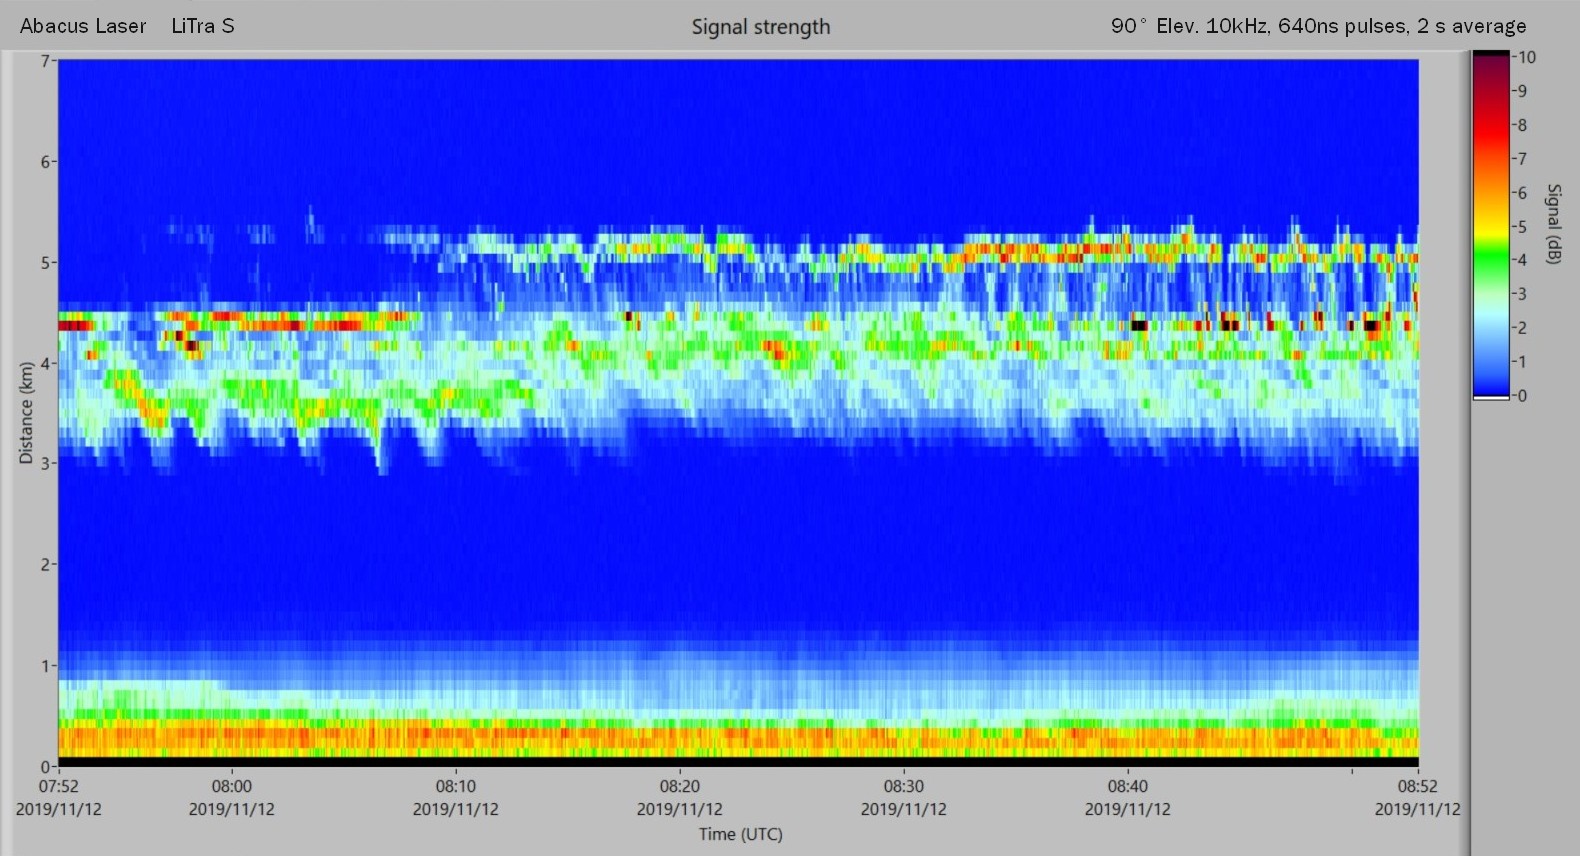
Signal strength for measurement with 90° elevation along a period of 1 hour

Wind speed for measurement with 90° elevation for a period of 1,5 hours

Signal strength for measurement with 90° elevation for a period of 1,5 hours
The following illustrations were taken with an elevation of 0.5°, i.e. almost horizontal. The measurements were taken from the Abacus Laser laboratory window in south-west direction and were positioned over the Leine valley directly south of Göttingen.
This measurement was taken at 8 kHz pulse rate, averaged over 5 s (i.e. 40,000 shots).

Wind speed for measurement with 0,5° elevation for a period of 1 hour

Signal strength for measurement with 0,5° elevation for a period of 1 hour

Wind speed for measurement with 0,5° elevation while a thunderstorm was approaching

Signal strength for measurement with 0,5° elevation while a thunderstorm was approaching
In order to test the performance over a short distance with high spatial and temporal resolution, measurements with a short pulse length of 160 ns were recorded during a storm. At a pulse rate of 78 kHz, the averaged values were recorded for 0.1 s, i.e. 10 measurements per second. Gusts of up to almost 22 m/s are clearly visible.
The laser was aligned to the west with 1° elevation.

Wind speed for measurement with 1° elevation for a period of 5 minutes

Signal strength for measurement with 1° elevation for a period of 5 minutes